


Even though COVID-19 started wreaking havoc early into 2020, the past two years have still suffered the consequences of a pandemic. Educational institutes are facing staff shortages, among many other obstacles.
In the midst of all this, some public schools (attended by a whopping 90% of students in America) are managing to thrive.

Scholaroo has now released a first-of-its-kind report revealing the best and worst school systems of 2022, comparing all 50 states across America to see how they’ve fared in terms of student success, school quality, and student safety.
The data set considers a depth of topics across 42 key indicators, ranging from metrics that measure how much a student is enabled to succeed, to metrics that measure the school’s security.
Based on these metrics, Kentucky’s schools ranked 19th on Scholaroo’s 2022 Best & Worst Schools Systems report.
2022 Best School Systems Rankings: Kentucky
(In order of ranking, numerical ranking based on all-states position)
#19: Overall
#19: Student Success
#23: School Quality
#22: Student Safety
Other interesting insights:
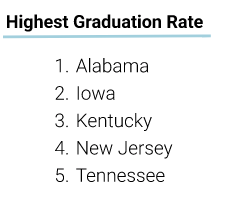
• Kentucky ranks as the 5th state with the highest high school graduation rate.
• Kentucky is the #10 state with the highest SAT scores.
• Kentucky holds the 21st highest college-going rate.
See total rankings and methodolgy here.

Aside from the significant methodological problems with Schoolaroo’s approach that I noted in my earlier comment, this has managed to get even more confusing.
The Schoolaroo web cite the Tribune article links to (https://scholaroo.com/state-education-rankings/), which is dated January 12. 2022, has a map that agrees with the one in the N. KY Tribune artlcle.
However, I discovered another article from KLAS in Las Vegas (https://bit.ly/3dJLjR7) dated February 17, 2022 about the report that has a somewhat similar map, but it shows Kentucky ranking 27th, not 19th.
This Las Vegas version came out more than a month after the version that the N. KY Tribune links to.
So, which is it? 19th or 27th, or who knows what?
I wonder what is going on.
Schoolaroo’s web site doesn’t provide any contact information except to ask for scholarship help. Maybe the Tribune can track down some answers for us.
Thank you, Mr. Innes. Your points are well taken. We’ve shared them with our contact at Scholaroo and await their response. Will share with you and our readers when we have it.
We have connected Mr. Innes to our source at Scholaroo so that he can explain his concerns directly. Scholaroo is a respected scholarship platform. This was its first foray into conducting a survey involving state comparisons and while we found the results interesting we did ultimately identify inconsistencies in the data reporting. We’ll be more careful in the future.
This is another example of how people who don’t really understand the limitations in the data come up with some really dubious findings.
Just a few examples:
1) While the tests are not actually identified, the rankings apparently only consider overall average National Assessment of Educational Progress (NAEP) scores for reading and math in grades 4 and 8. That’s an invalid method which just winds up comparing lots of white student results in Kentucky to results for kids of color in other states. Thanks to the endemic achievement gaps, only looking at overall average scores always makes Kentucky look better than it actually is. For a more detailed explanation and a much better understanding of how Kentucky ranks in these academic areas, check this out: https://bit.ly/3rgBgqP
2) The rankings look at high school graduation rates, but there are absolutely no cross-state standards for what it takes to graduate. Given facts such as Kentucky’s white students actually ranking well below the middle for both math and reading results (see the reference in item 1), the state’s high graduation rate is obviously due to low standards, not exemplary performance.
3) You can’t intelligently rank all 50 states for either ACT or SAT scores. In most states participation is voluntary and the students who take the tests are a self-selected group, not anything close to a valid random sample. The high SAT for Kentucky is particularly misleading as Kentucky is an “ACT” state where very few students, mostly those who want to apply to prestige colleges on the East and West coasts, are probably the only participants in SAT testing. It’s anything but a valid random sample.
There are a lot of other gaffes with data in this ranking scheme, but the idea that Kentucky would rank 19th for student achievement when the state’s white students, who comprise 75% of the entire public school enrollment, rank near the bottom (46th place) on Grade 8 NAEP Math results in 2019 is just ludicrous. Again, check the reference linked in Item 1 for a much better picture.
What are the metrics used to ascertain how the school system is ranked?
Is it based only upon grad rate? That would be absurd to the point of journalistic malfeasance.
What about rate of acceptance to 4 year college?
What about scores on nationally standardized testing?
The story contains a link to the study and its methodology. It also makes clear three categories of focus: student success, school quality and student safety. Of course it wasn’t just based on graduation rate; that was just one of the components.