


By Hannah Hill
Farm Flavor
As Americans prepared for today’s Thanksgiving, a holiday that centers around food, family and the harvest, it’s worth reflecting on where that food comes from – and who produces it. While the U.S. food system is supported by global trade, the vast majority of what Americans eat is still grown or raised at home. According to the U.S. Department of Agriculture’s Economic Research Service, imports account for less than 20% of U.S. food and beverage spending, underscoring the central role of domestic agriculture in feeding the nation.
The report by Farm Flavor — a company that provides news and information about the agriculture industry — uses the latest federal data to examine agricultural productivity across the country, highlighting regional differences in what is grown and where. It explores trends in agricultural output, identifies the predominant products in different areas, and ranks the nation’s top agricultural states and counties based on the total market value of goods produced.
U.S. agricultural productivity over time
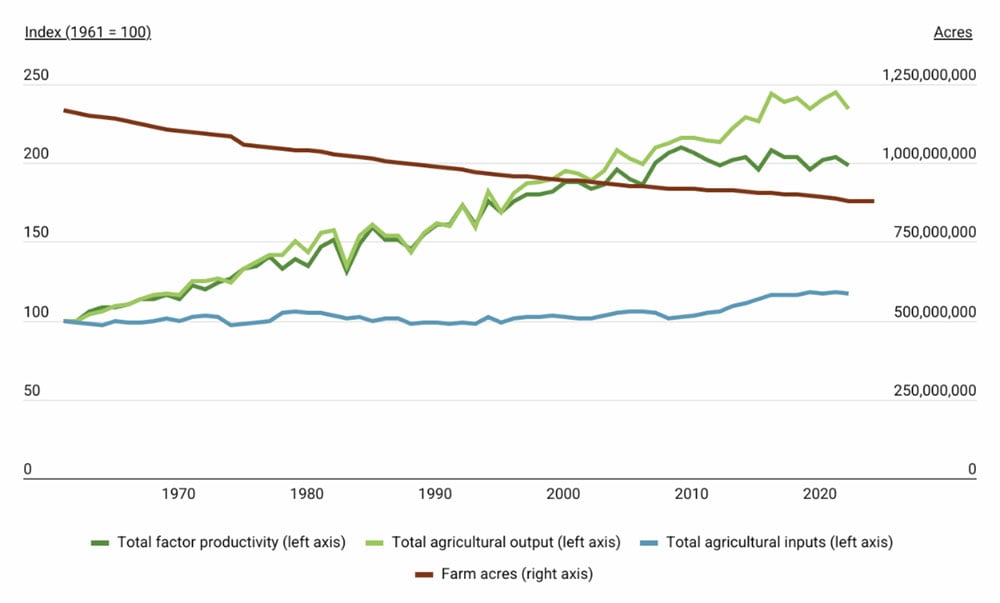
Since the mid-20th century, U.S. agriculture has undergone a quiet revolution: farm output has more than doubled even as the total use of inputs – such as land, labor, capital and intermediate inputs like fertilizer – has remained largely unchanged. This growth in productivity is the result of sustained investment in agricultural research, technological innovation, improved crop and livestock genetics, and more efficient farm management practices. Today’s farms often rely on precision agriculture tools such as GPS-guided tractors, drones for crop monitoring and AI-powered software to optimize planting, irrigation and harvest decisions.
Between 1961 and 2022, total agricultural output increased by nearly 2.5 times, while total inputs rose by just 17%. As a result, total factor productivity – a measure of output relative to input – has steadily climbed, indicating that American farmers are producing more food with fewer additional resources. These gains have helped meet the demands of a growing population while keeping food relatively affordable – even as total farmland has declined by roughly 25% over the same period.
The most popular agricultural products in each state
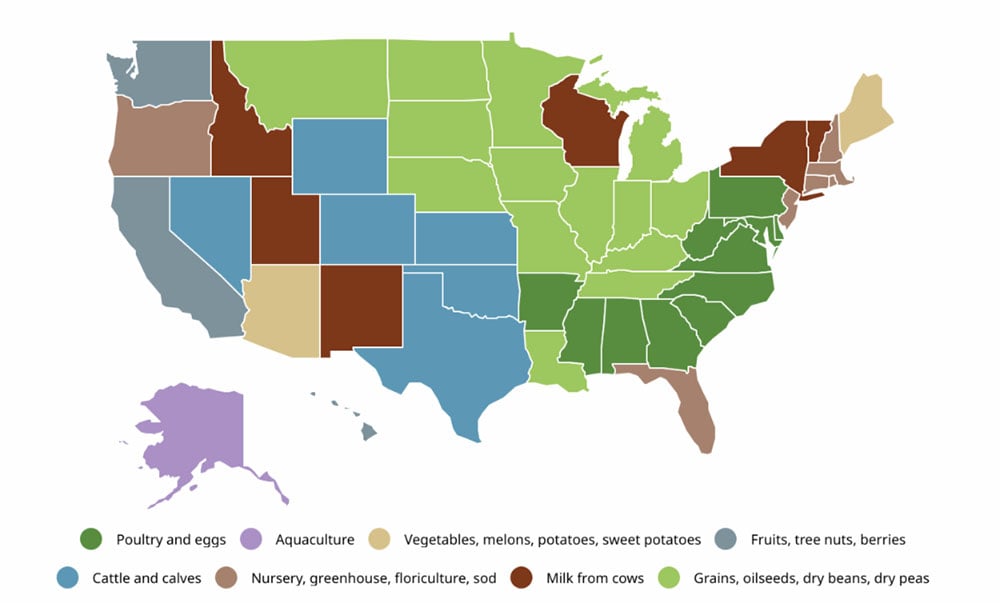
While national agricultural productivity has increased steadily over the past several decades, what is produced – and where – still reflects longstanding regional patterns shaped by climate, geography, infrastructure and market access.
In the Southeast and Mid-Atlantic, poultry and eggs are the top agricultural products across 11 states, including North Carolina and Mississippi. This dominance reflects the region’s warm climate, year-round production capacity, and well-developed processing and distribution systems.
The Midwest specializes in grains, oilseeds, dry beans and peas. States like Iowa and Illinois benefit from fertile soil, flat terrain and infrastructure tailored for bulk commodity farming. Their central location also supports efficient transport to domestic and international markets.
To the west, a cluster of Great Plains states – led by Texas agriculture – dominates in cattle production, supported by expansive rangelands well-suited for grazing. West Coast states are more agriculturally diverse. California and Washington focus heavily on fruit and nut production, while Oregon stands out for its nursery and greenhouse industries. Alaska, distinct from the rest of the country, leads in aquaculture thanks to its access to cold-water fisheries.
States with the greatest agricultural output
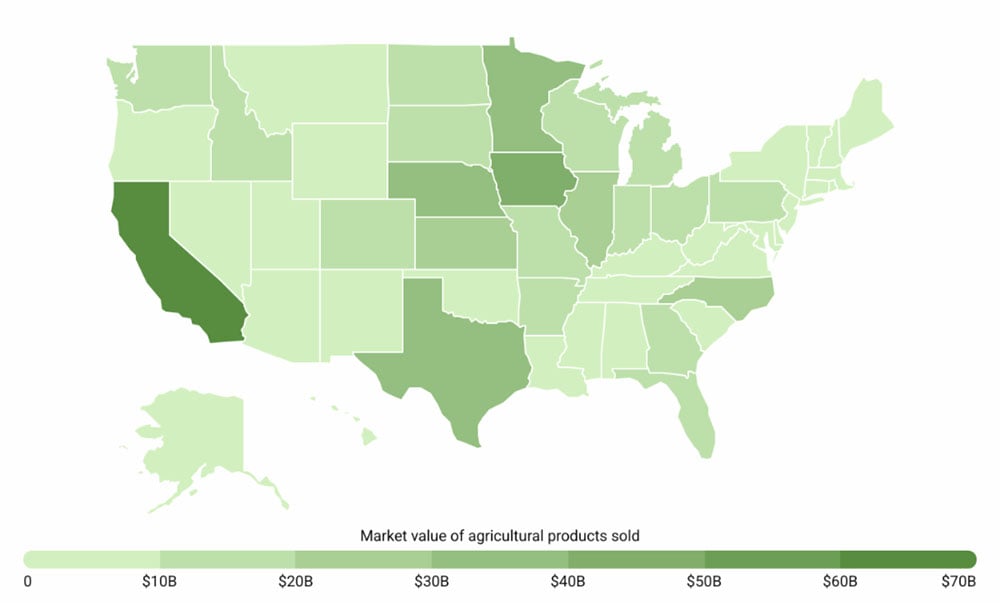
While all states contribute to the national food supply, a smaller group of high-output states dominate the industry in terms of total market value.
California leads by a wide margin, accounting for 10.9% of all U.S. agricultural output. Known for its diversity of crops, California’s long growing season and extensive irrigation systems support high-value production of fruits, nuts, vegetables and dairy. The Midwest follows closely, with Iowa, Nebraska, Minnesota and Illinois each contributing between 4.9% and 8.1% of total U.S. value – driven primarily by grains, oilseeds and livestock. Texas, another major contributor at 5.9%, leads in cattle and also produces significant volumes of poultry, dairy and cotton.
Notably, some states generate high agricultural value despite relatively small populations. Iowa and Nebraska, for example, rank second and fourth in total output, respectively, but rank 31st and 37th in population, highlighting their economies’ heavy reliance on agriculture. In contrast, states like Florida, New York and Pennsylvania have large populations but rank lower in agricultural value.
At the county level, a cluster of high-performing agricultural hubs is concentrated in California’s Central Valley. Fresno County, the nation’s top agricultural county, generated over $7.7 billion in agricultural sales in the most recent year, led by fruit and nut production. Nearby Tulare County follows closely with more than $7 billion in output, driven by dairy. Other top-producing counties like Monterey, Kern and Merced also specialize in high-value crops such as fruits, vegetables, and milk. Notably, California is home to all but one of the nation’s top 10 agricultural counties.
Outside of California, major counties include Grant and Yakima Counties in Washington, known for fruit production; Weld County, Colorado, and Sioux County, Iowa, both leading in cattle and livestock; and Sampson County, North Carolina, a national leader in hog farming. These counties stand out not just for the scale of production, but also for how deeply agriculture is embedded in their local economies – in some cases accounting for over 20% of total employment and more than 90% of all land use.
Summary of the data for Kentucky:
• Market value of agricultural products sold: $8,844,634,907
• Share of total U.S. agricultural value: 1.5%
• Most valuable agricultural products: Grains, oilseeds, dry beans, dry peas
• Crop sales: $4,188,639,197
• Livestock and other animal product sales: $4,655,996,814
• Number of farms: 69,425
• Agriculture share of total land area: 49.2%
• Agriculture share of total employment: 1.3%
Statistics for the entire United States:
• Market value of agricultural products sold: $599,995,091,745
• Share of total U.S. agricultural value: 100%
• Most valuable agricultural products: Grains, oilseeds, dry beans, dry peas
• Crop sales: $310,033,985,236
• Livestock and other animal product sales: $289,961,105,404
• Number of farms: 1,900,487
• Agriculture share of total land area: 38.9%
• Agriculture share of total employment: 1.2%
The analysis draws on data from four primary federal sources: the USDA Census of Agriculture, the USDA Economic Research Service (ERS), the U.S. Census Bureau’s American Community Survey (ACS) 1-Year Estimates and the U.S. Bureau of Labor Statistics Consumer Price Index (CPI). Researchers examined both state-level and county-level data to identify the top agricultural hubs across the United States.
Locations were ranked based on the total annual market value of all agricultural products sold, encompassing both crops and livestock. All financial figures were adjusted to 2025 dollars using the CPI to ensure consistency across regions. For each county, the most valuable agricultural products – defined as the category generating the highest share of total market value – were also identified.
Additional indicators from the USDA and ACS, including the number of farms, total agricultural land area and agricultural employment, were also included. Only counties with complete data from all sources were included in the final results.
Farm Flavor is a digital publication that provides data-driven reporting of U.S. agriculture, crops, livestock, agritourism and farm-to-table food, often in partnership with state departments of agriculture.