


By Jan Hillard
NKyTribune data editor
First of two parts
Every day in our country, 61 babies die before their first birthday, 826 babies are born without health insurance, 1683 babies are born into poverty, 2956 high school students drop out, 248 children are arrested for drug crimes.
The current state of our children’s lives will determine the quality of their lives and the lives of all us. Unfortunately for some children, the quality of their family life, their health, their education, and the support they receive from their community is severely lacking. These children not only struggle in the moment but will face potentially bleak opportunities as they enter adulthood A vicious cycle results and it becomes almost intractable.

There is hope. Communities all over the nation, and across Kentucky, have embraced improving their children’s lives and have marshaled human capital behind educational, health, and welfare innovations.
These communities are showing improvement and must be held up as models. Nationally, childhood poverty has declined, high school graduation rates are up, teen births are declining as are children in foster care and youth incarcerations.
Innovation and change begin with assessing where we have been, where we are, and where we predict we are going. Data on childhood quality of life is now abundant and easily accessed, allowing states and communities to monitor progress, compare themselves to peer communities, and set future targets. Nationally, this essential data has been archived by the Children’s Defense Fund, the Annie Casey Fund, and others.
In Kentucky, we are fortunate to have Kentucky Youth Advocates (KYA). Their annual report, Kids Count County Data Book provides essential, comparative data that can inform and guide Kentucky’s child welfare efforts.

Child welfare indicators typically fall into 6-9 major categories. Together these represent the major forces surrounding a child’s life. They include: child poverty, income and wealth inequality, housing and homelessness, childhood hunger and nutrition, childhood health, early childhood education, foster care, youth justice, and gun violence. Reading through this list, it is easy to imagine how a child’s welfare could be indelibly impacted by these factors.
Before reporting on Kentucky’s key indicators and the place of Kentucky among the 50 states, it is important to briefly review findings from, America’s Children: Key National Indicators of Well-Being, 2021. This report is produced by ChildStats.gov.
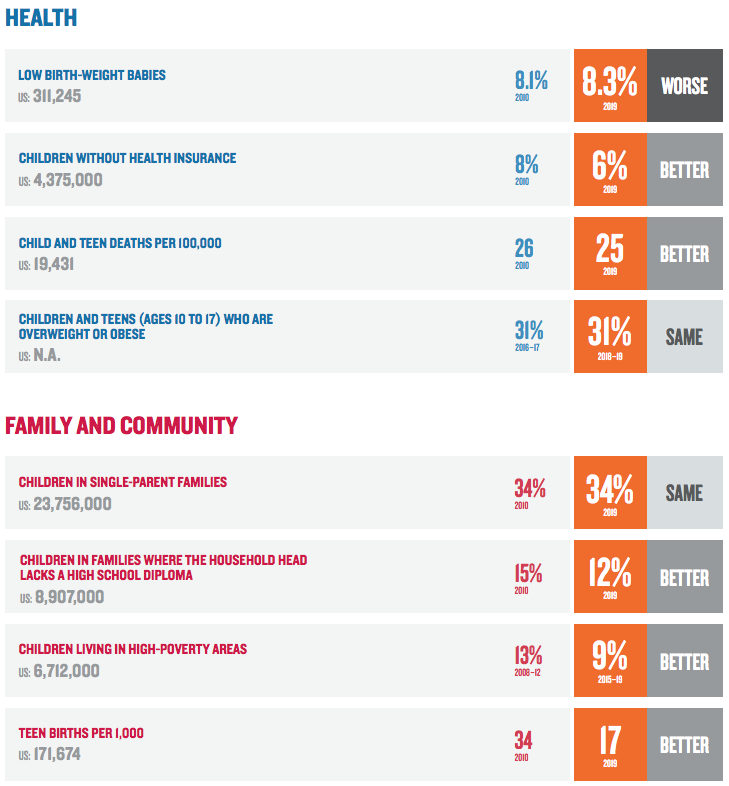
Across our 72.8 million children ages 0-17, challenges include the following:
• First, the dramatic growth in the racial and ethnic diversity of children. Today 48% of all children 0-17 are White, Non-Hispanic. Communities often lack responsiveness to racial and ethnic diversity in educational and health care systems. 14.4% of all children (10.5 million) live in poverty.
• Second, children in poverty are twice as likely to be affected by untreated dental and general health problems. Dental health is one of the strongest predictors of educational success as it stands for many other developmental factors. Research some years back by the University of Kentucky Dental School documented this.
• Third, 10% of 8th graders and 22% of 10th graders report illegal drug use. Nationally, there are positive developments. These include: 78% of children regularly read to, higher math and science scores in grades 4 and 8 and 94% of children 17-24 completing high school. 66% of these graduates enrolled in two- or four-year colleges.
See this graphic showing the overall welfare of children across the country:
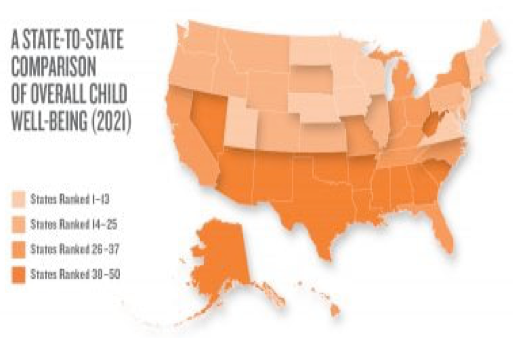
It indicates that today, as in the recent past, states in the Northeast and Upper Midwest have the highest levels of child well-being, followed by states in the West. Southern states continue to have the lowest levels of child well-being.
A report from the Annie E. Casey Foundation titled, Kids Count, 2021 compares 16 indicators of child well-being for each state. Out of the 50 states, Kentucky ranks 37th in the nation. Across the four indicators of economic well-being, Kentucky ranks 40th in the nation. The four indicators of education place Kentucky 30th in the nation. On the four indicators of health, Kentucky ranks 35th and 43rd in the nation for the four indicators of family and community.

Kentucky Youth Advocates provides data on the 16 key indicators of child welfare for each county in Kentucky. This especially valuable in helping communities and school districts understand the challenges they face. Counties that are showing improvement can serve as models for counties that are challenged.
Data for the three largest counties of Northern Kentucky in detail can be found here:
• Boone,
• Kenton, and
• Campbell.
For 8 of the indicators, Boone County ranks in the top 10 counties in Kentucky. For four indicators it ranks in the bottom 25%. For three indicators of child welfare, Kenton County ranks in the top 10, while 10 indicators place the county in the bottom 25% of all the Kentucky counties. Campbell County ranks in the top 10 of all counties in 9 indicators and in the lowest 1/3 in 3 indicators.
The comparative data presented in these tables is essential in knowing where each county stands within the Commonwealth, and as importantly, the change in each indicator from prior years.
Today good data on children’s well-being is readily available. The data is comparative and multi-dimensional, facilitating analysis and action. Unfortunately in the past, data could be hard to find and wasn’t readily available. Access to actionable data suffered due to differing data definitions, incomplete reporting, and protective impulses.
Without good data, decision-makers struggle to strategically apply scarce public funds to the key leverage points that can improve the lives of children. Thanks to hard work and giving, these challenges are obstacles of the past. Now we must take action on the data and develop appropriate public policy responses to child well-being. This will be the test of our resolve and if, in fact, good data can make a difference for our children.