


By Brenna Keller
NKyTribune associate editor
 The American Lung Association has released their State of the Air 2026 Report.
The annual report examines two of the most widespread and dangerous air pollutants, fine particulate matter and ozone.
The Clean Air Act, which passed in 1970, requires the U.S. Environmental Protection Agency (EPA) to set health-based limits for six outdoor air pollutants, including particulate matter and ozone. These limits are called National Ambient Air Quality Standards. They use health science to identify safe breathing levels of each pollutant. The standards must be periodically updated to reflect any scientific advances.
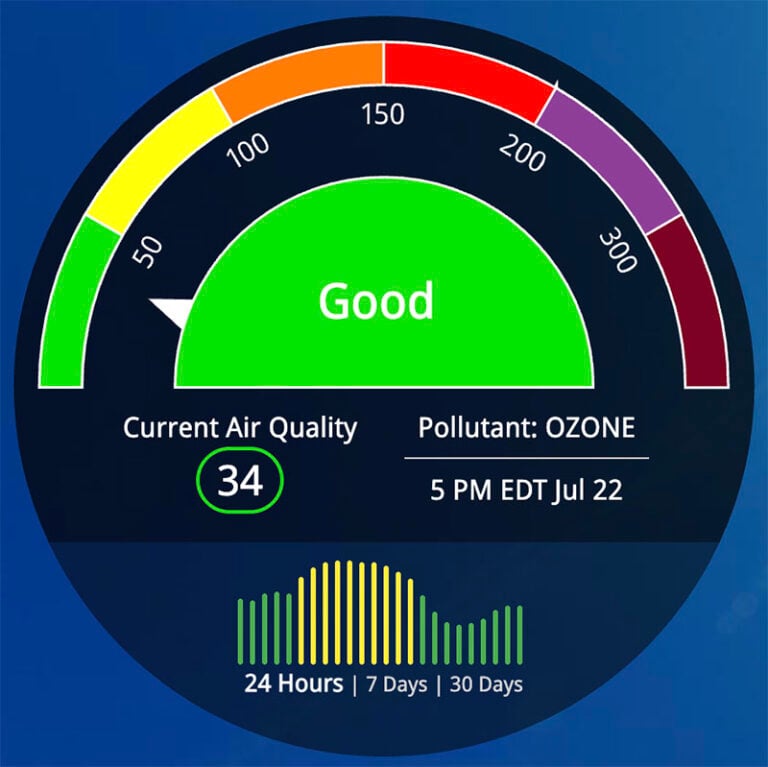
The standards are color-coded to alert the public about dangerous air pollution levels. People can take precautions to minimize their exposure during times when air pollution is high.
The health impact of air pollution
 Particle pollution and ozone are a threat to human health at every stage of life. They increase the risk of premature birth, cause or worsen lung and heart disease, and shorten lives.
Respiratory effects include wheezing and coughing, shortness of breath, asthma attacks, worsening COPD, and lung cancer. Other health effects include premature death, susceptibility to infections, heart attacks and strokes, impaired cognitive functioning, metabolic disorders, preterm births, and low birth weight.
Air pollution exposure in childhood can cause long-term harm. It can impede lung growth, contribute to new asthma cases, and increase risk of respiratory diseases.
Air pollution data
American Lung Association publishes the annual “State of the Air” report to provide the public with easy-to-understand information about the air quality in their communities. The report relies on data and science that EPA is required to use to set and enforce the air quality standards.
Data were obtained from the EPA’s Air Quality System. The data covered a three-year period, from 2022-2024. Hourly ozone and short-term particle pollution were averaged for each monitoring site. Additionally, year-round particle pollution data were obtained from the EPA’s website.
The report identifies the highest 8-hour daily maximum concentration of ozone for each county. The current National Ambient Air Quality Standard for ozone is 70 parts per billion. Based on that standard, the EPA Air Quality Index is:
- Good (Green): 0-54
- Moderate (Yellow): 55-70
- Unhealthy for sensitive groups (Orange): 71-85
- Unhealthy (Red): 86-105
- Very unhealthy (Purple): 106-200
- Hazardous (Maroon): >200
 The American Lung Association identified the number of days that 8-hour daily maximum ozone concentrations in each county occurred within those defined ranges.
The particulate matter data included were for fine particles, identified as PM25. Particulate matter is a mixture of tiny bits of solids and liquids in the air. Fine particles are often a by-product of burning wood or fossil fuels and may include toxic compounds, salts, and metals. The body’s natural defenses cannot keep these particles from reaching the lungs.
The current short-term National Ambient Air Quality Standard for PM25 is 35 micrograms per cubic meter measured over 24 hours. The ranges identified by the EPA based on the Air Quality Index are:
- Good (Green): 0.0 to 9.0
- Moderate (Yellow): 9.1 to 35.4
- Unhealthy for sensitive groups (Orange): 35.5 to 55.4
- Unhealthy (red): 55.5 to 125.4
- Very unhealthy (Purple): 125.5 to 225.4
- Hazardous (Maroon): Greater than or equal to 225.5
The American Lung Association identified the number of days that 8-hour daily maximum PM25 concentrations in each county occurred within those defined ranges.
Ozone and short-term particle pollution levels were assigned grades (A, B, C, D, or F) based on a weighted average calculation. Days with worse air pollution received a greater weight. Weighted averages allow comparisons to be drawn between counties.
Annual PM25 concentration by county was identified using design values retrieved from the EPA website. They were assigned “passing” or “failing” grades.
For an in-depth exploration of the methods and data used, see the “State of the Air.”
Key findings
 The report found that more than 4 in 10 people in the U.S. (44% or 152.3 million people) live with unhealthy levels of air pollution. Nearly half of children in the U.S. live with unhealthy levels of air pollution.
Infants, children, and teens are especially vulnerable to the health harms of breathing air pollution, because
- Their lungs are still developing.
- They breather more air for their body size than adults.
- They frequently spend more time outdoors.
More than 129 million people live in counties with F grades for ozone pollution. Ground-level ozone pollution (smog) is the most common pollutant making it difficult for people in the U.S. to breathe.
The report also identified climate change as contributing to air pollution. There have been increases in high ozone days and spikes in particle pollution related to extreme heat, drought, and wildfires.
Data centers were noted to be an increasing source of air pollution. They contribute to poor air quality through power consumption linked to grid emissions and diesel-powered backup generators. Communities located near large data center clusters often experience higher pollution burdens than other areas in the region.
Local impact
Not all counties have air pollution monitors. Therefore, many communities, especially rural communities, do not have official information on air quality. For this report, 885 counties had enough monitoring data to be assigned a grade for at least one pollutant.
Nationally, Louisville, KY ranked 22 out of 25 metropolitan areas for ozone pollution. The Cincinnati metropolitan area is tied at 17 for the most polluted by annual particulate matter in the country.
The report does not include data for Kenton County, but does have results for Boone and Campbell Counties, as well as Hamilton County, OH.
 Boone County
- Ozone pollution: D
- 24-hour particle pollution: no data available
- Annual particle pollution: no data available
Campbell County
- Ozone: C
- 24-hour particle pollution: C
- Annual particle pollution: Pass
Hamilton County
- Ozone: F
- 24-hour particle pollution: D
- Annual particle pollution: Fail
Recommendations for action
The report concludes with recommendations for action. The stated overarching call to action is to tell the EPA “Our kids’ health counts.” The American Lung Association emphasizes that the EPA must follow science and the law to protect the public’s health, particularly the health of children.
State and local governments are encouraged to:
- Invest in infrastructure to support increased use of electric vehicles, walking, biking, and transit rather than expanding highway capacity.
- Require more electricity to come from clean, non-combustion sources like wind, solar, geothermal, and tidal.
- Adopt policies to reduce emissions from buildings, industrial manufacturing facilities, and freight activities.
Individuals can keep themselves safe on days with poor air quality by:
- Checking daily air pollution forecasts at AirNow.gov.
- Preparing for wildfires and other disasters.
- Reducing emissions from their vehicle or home energy use.
- Speaking up for clean air policies.